 MyMemeCards editorial team
Watch the ref
Nobody has added this meme's ref yet. Got the original video or post?
In MyMemeCards, the meme card game, “Data Visualization” is a common card of the Memes World series 46, number 13527 of the collection, and the 1st best-known meme of its 294 cards. Here is what the meme means, where it comes from, and how to get its card.
What does the “Data Visualization” meme mean?
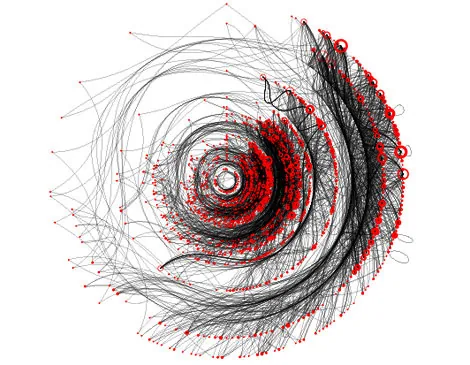
When people talk about dataviz online, they mean the craft of making figures readable and sometimes beautiful: a clean chart, an infographic that sums up a complex topic, a diagram that makes you smile. The term also names a culture of enthusiasts who share their work, compare methods and enjoy absurd correlations between unrelated statistics. It is used to praise a well-made graph or to mock a misleading visual.
Where does the “Data Visualization” meme come from?
The practice goes back to the seventeenth century. In 1644, Flemish astronomer Michael Florent Van Langren is believed to have produced the first visual display of statistical data: a single line showing twelve known estimates of the longitude gap between Toledo and Rome, each labeled with its astronomer. The chart shows the spread between estimates far better than a table would. Online, the community took shape in the late 2000s: /r/visualization was created on March 25, 2008, /r/dataviz on January 5, 2009, followed by the blog Datavisualization.ch. In July 2010, David McCandless gave a TED Talk on the beauty of data. The platform Visual.ly arrived in April 2011, and /r/dataisbeautiful on February 14, 2012.
- 1644Michael Florent Van Langren draws what is considered the first visualization of statistical data.
- March 25, 2008The /r/visualization subreddit is created.
- January 5, 2009The /r/dataviz subreddit is launched.
- July 2010David McCandless gives his TED Talk on the beauty of data visualization.
- April 2011The community platform Visual.ly launches.
- February 14, 2012The /r/dataisbeautiful subreddit is created.
How to use the “Data Visualization” meme
- Share a polished chart on /r/dataisbeautiful and talk through the color choices.
- Illustrate a presentation with an infographic instead of a table of numbers.
- Point out an absurd correlation between two unrelated statistics, Tyler Vigen style.
Also searched as
- Data Visualization
- dataviz
- infographics
- information visualization
- data visualization
- data visualization meme
- what is dataviz
- history of data visualization
- first data visualization van langren
- dataisbeautiful reddit
- tyler vigen spurious correlations
The “Data Visualization” card in MyMemeCards
| Number | No. 13527 |
|---|---|
| Rarity | Common |
| Collection | Memes World series 46 |
| Fame | 57/100 · #1 of 294 |
| Recycle value | 5 MemeCoins (15 in Shiny) |
| Meme page views | 12,329 |
How to get the “Data Visualization” card
Every pack holds 5 meme cards, the first 3 of them Common; Data Visualization comes out of the Memes World series 46 as a common card. The pack odds say what each rarity weighs.
Your first pack is free and needs no account. After that a new free pack lands every 10 minutes, up to 3 waiting for you. You can also buy the card with MemeCoins on the market, bid for it at auction, or trade it — and a double recycles into 5 MemeCoins.
Open your free pack
5 meme cards, one of them at least Rare. One free pack per person.
Free · no account needed
Odds per card, averaged over a pack: Common 72%, Rare 23.9%, Epic 3.2%, Legendary 0.56%, Mythic 0.3%, Full Art ≤ 0.1%, Shiny 0.2%. Cards 1 to 3 are always Common, cards 4 and 5 climb the rarities. Rates drop for cards that circulate a lot. Details
Memes like “Data Visualization”








More cards of the Memes World series 46








Frequently asked questions
What is data visualization?
It is the use of images, diagrams and schematics to represent data and information. Online it mostly shows up in infographics and flowcharts.
What was the first known data visualization?
Michael Florent Van Langren's 1644 graph, which lined up twelve estimates of the longitude difference between Toledo and Rome.
Where can you share data visualizations?
On subreddits like /r/dataviz, /r/visualization or /r/dataisbeautiful, and on platforms such as Visual.ly.
How do absurd correlations fit in?
In 2014, statistician Tyler Vigen launched a blog showing graphs with strong correlations between random, unrelated statistics.
How do I get the Data Visualization meme card?
Open a pack of MyMemeCards: “Data Visualization” is a common card of the Memes World series 46. Your first pack is free, with no account, and you can also buy, trade or win the card at auction.
How rare is the Data Visualization card?
It is a Common card. Rarity decides which pack slot can deal it, and what it is worth on the market.
Sources: Know Your Meme · checked on October 2, 2026.
Read next
Want Data Visualization in your collection?
Open your free pack: 5 meme cards, no account needed.